
Life of Pie: Housing
Published: 2026-03-25
You may have read my previous posts Building Your Financial House, which gives you a high level picture of healthy finances, and then I’m Ready Now What?, which gets you prepped for today’s post. If you haven’t read both of those, I recommend that you jump back to them now before proceeding.
We’re going to talk about pie – not the yummy dessert like my Grandmother used to bake; Rather, we’re going to check out a pie chart to give you perspective on your spending at a glance, proportionally speaking.
Portion Control
It’s important to note that pie, both the baked kind and the chart kind, are finite. When you cut a large slice for one plate, there is less pie for every other plate. The money you have to spend every month is the same idea – you only have so much to go around. We don’t depend on credit (because, if we do, we are sinking!), so we can only portion out our pie based on the planned incoming cash we earn on a monthly basis.
Over the course of the next few weeks, we’ll look at the (up to) five pieces you should cut your pie into for a balanced financial life. For each slice, I will give you a target percentage. But let’s be real for a moment. Life is squishy, and your pie will likely never be 100% perfect. You can always make trade offs. You might make one slice smaller so that you can make another slice bigger. The important part is that you are being intentional and you understand the impact of your choices. Targets can help you understand why you might feel like you can’t get ahead with your money. If you are spending a lot more than your target, odds are life is going to feel impossibly tight. The MWM spending targets offer a balanced life that’s designed for long term success; comparing your spending to my model will show you focus areas to consider life changes.
How Big is your Pie?
In step 2 of the MWM Homework Day 0 you gathered your net income. Your net income is the size of your pie.
Grab that number. Make yourself a copy of the MWM Budget Tracker (available from my website’s resources section) and add your number to the Spending worksheet in the Income table.
Taking your First Slice
Our first slice of pie is housing. I like to start with housing because it’s a fundamental need for everyone and your monthly costs should generally stay fairly consistent, unless you’ve moved.
Housing: Your monthly spending target is 35%
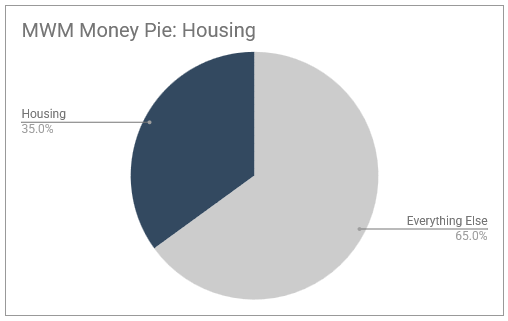
Within this category, you must capture all monthly housing costs related to dwelling:
- Rent or Mortgage
- Tenant or Home Insurance
- Utilities
- Electricity / Hydro
- Natural Gas
- Water
- Internet service to the home
- Property Taxes (if you own)
- Condo or Homeowners Association (HOA) Fees
- Home Maintenance
You will have already gathered your numbers for items 1 – 5 as part of your MWM Homework Day 0 prep work. Too easy! Grab those values and update your copy of the MWM Budget Tracker to the Expenses table of the Spending worksheet.
Item #6 is a bit trickier. You have some control over the timing of maintenance. It’s also generally only applicable to a property owner. You might choose to undergo home improvements that are partially maintenance but also are for personal preference (i.e. upgrading to stone counter tops). For now, if you are responsible for home maintenance, I recommend that you use this formula for your monthly target:
Value of Property * 1% / 12 = Your Monthly Maintenance Target
For example, if you own a home valued at $600k, here is how to calculate your target monthly maintenance budget.
$600,000 * 0.01 = $6,000 a year
$6,000 / 12 = $500 a month
Note: If you have an older dwelling or expensive tastes or just purchased a property, the 1% rule may not be enough. Consider adjusting your calculation up to 2% or 3%, depending on what feels right for your situation.
Finally, let’s take the numbers that you’ve gathered and check them against your target using this calculation:
{Sum of all Monthly Housing Costs} / Your Monthly Net Income * 100 = Your total housing percentage
Example:
Monthly Net Income: $6000
Expenses: Rent $1850, Tenant Insurance $30, Utilities with Internet $220 = $2100
$2100 / $6000 * 100 = 35%
Check In: How Did you Do?
You can now check your first slice against the MWM model budget. How did you make out?
I don’t have any housing costs – Perhaps you don’t have housing costs yet, for example if you live with your parents. You might save 35% of your net income into a high interest savings account and this will be your “move out” money. Starting to put that amount away now will make it easier to keep the habit of living within your means later.
I am on target – Is your percentage at or under 35%? Congratulations, you are on target! If your percentage is less than target, you have more money to direct to other pieces of your money pie.
I am over target :/ – Is your percentage over 35%? As I mentioned earlier, this is not necessarily a reason to panic. It is an invitation to think critically about why your housing costs are higher than the MWM model target. Are there changes you might make to bring down your housing costs? Do you need to consider making more money to get your pie back in balance? Is sharing costs with a roommate an option? Keep your Housing slice in mind in future weeks as we carve out the rest of your money pie. Some of those other slices will need to be slimmer to accommodate a larger slice for dwelling.